Stabilization Rates
One of the most common issues NBA fans and analysts grapple with in analyzing players is when does a certain level of new performance become ‘real’, e.g., “Marcus Smart is shooting 54% from three after 4 games: has he had a breakout, or this just noise?” Enter the concept of ‘stabilization rates’, which is the idea that a player needs some number of shooting attempts or possessions before they ‘own’ a skill (alternatively you can use DARKO).
Stabilization rates are a concept which were originally popularized by Russell Carleton (AKA Pizza Cutter) writing about baseball, but have come to basketball as well from Darryl Blackport, Krishna Narsu, Nathan Walker, myself (and again), and others. In short, the idea is that at some point in a season, the skill aspect of a player’s performance starts to outweigh in the inherent randomness in player performance, and stabilization rates are an attempt to figure out when that point is.
There are a lot of different ways to calculate stabilization rates – Carleton and Blackport used something called a “Kuder-Richardson 21 reliability score”, which involves grouping plate appearances/shooting attempts into buckets, and looking for the relationship in those buckets. Narsu simply looked for the point in the season at which a team’s current performance has more than 0.5 R^2 with their final statistics in a given metric. I prefer a predictive approach, via the ‘padding method’, which I first read about from Justin Kubatko, but is commonly employed by Tangotiger as well, and I presume has some long storied history I’m ignorant of.
The Padding Method
Under the ‘padding method’, at any given point in the season, you ‘pad’ a player’s performance with some sample of league-average performance, and that’s your projection of a player’s talent going forward the rest of the season. To take three point attempts as an example, Duncan Robinson opened the 2019-2020 season by shooting 17 of 34 from three (50%). There’s presumably some randomness in that performance, so we ‘pad’ both the numerator and the denominator there with some amount of league average performance (call this number X), to get a projection in the form of:
expected_fg3_pct = (17 + X*league_average_fg3_pct)/(34 + X)
If the padding number for threes is 240 (more on how to calculate this later), and the league average three-point-percentage is .355, then our projection becomes:
expected_fg3_pct = (17 + 240*.355)/(34 + 240) = .373
So Robinson’s 34 attempts from three have raised our estimate of his three-point shooting talent from .355 (league average) to .373 (good, not great shooter). I think that roughly aligns with our intuitions as well – 34 attempts just isn’t very many, so we can’t go too wild, but it’s a nice sign all the same.
The beauty and elegance of the padding method is that the amount of padding remains constant throughout the season. You don’t need to use different coefficients depending how much of the season has elapsed. At all times – you just add 240 attempts of league average performance to a player’s shooting to get their future projection. Early on, the 240 ‘padding’ attempts totally dominate a player’s projection. But eventually, as the sample size grows, the player’s actual performance has a bigger and bigger impact.
Applying that to Robinson, you get the chart below, showing the progression of his projected shooting in red, and his actual YTD performance in blue. The cadence is the same, but the projection is naturally more conservative.

Padding Values Are Stabilization rates
So what does the padding approach have to do with stabilization rates? Well – they’re actually the same thing. Before games on January 3, 2020, Duncan Robinson had taken 237 threes, and made 110 of them. At that point in the season, his projection was:
expected_fg3_pct = (110+ 240*.355)/(237 + 240) = .409
Meaning at that point, roughly half his projection was the 237 attempts he’d actually made, and half was the 240 padding attempts. After that game, the 240 padding attempts made up less and less of his projection, and his projection consisted mostly of his own performance. I emphasize ‘mostly’ here to reinforce that there’s nothing magical about the ‘stabilization point’, or about 50%. We still add 240 league average attempts to Robinson’s projection even after this point – they just have less and less relative impact. (I’m not a huge fan of the term ‘stabilization’ for this reason, since it implies after X attempts a player’s performance is “stable”, but I’ve given up fighting on this point).
I’m a big fan of the ‘padding approach’ as a way to address the stabilization question for its simplicity and directness. It doesn’t involve somewhat opaque statistical methods such as KR21 rates, and it directly answers the question most people want to know when they’re discussing stabilization: how do we project this player going forward?
With that somewhat lengthy preamble out of the way, here are the padding numbers/stabilization numbers for the main basic and advanced box-score metrics, sorted by most ‘stable’ to least, along with what I suggest ‘padding’ each metric’s performance with.
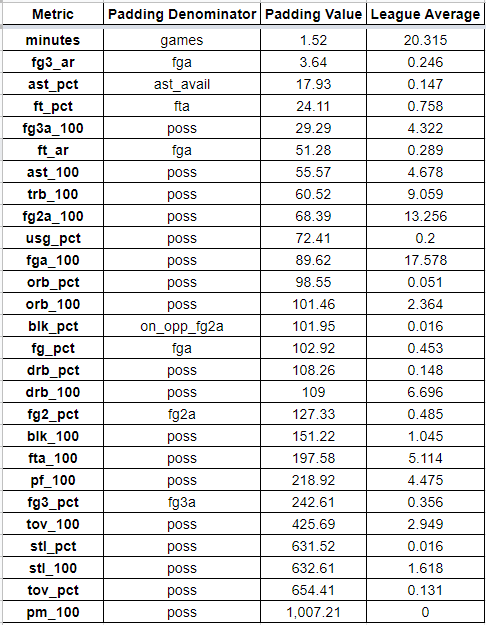
These were calculated the simplest way I know how – trial and error via differential evolution, finding the best ‘padding’ number to add to year-to-date performance for each player, after every game of the season, for every season since 2001, to best predict rest-of-the-year performance (about 750K rows of data).
As you can see, minutes are extremely stable (duh), since they’re almost entirely a coach’s decision and not a question of randomness/noise. On the other side, plus/minus data is extremely noisy, and you should regress a player’s performance by over 1,000 league average possessions going forward.
Note that three point percentage is relatively noisy at 242 attempts before your performance is mostly ‘real’ rather than noise. But even 242 attempts is a much smaller number than Darryl Blackport had found in his 2014 piece, where he concluded you needed 750 attempts for ‘stabilization’. For context, only 7 players have ever taken more than 750 three point attempts in an entire season, so this is a pretty big difference.
Note that there are other ways to do this: you could attempt to predict the next game’s performance instead of the rest of the season’s performance. You could also use career-to-date performance to project rest-of-season performance, or career-to-date performance to project rest-of-career performance. There are pros and cons to all these approaches, although they mostly matter less than you may expect (which is one of the virtues of the padding approach in the first place). I’ll explore the others in upcoming posts however, and also revisit my prior research on team-stabilization-padding rates.

Great article
LikeLike
For binary statistics (extremely common in baseball and basketball) you can use a Beta distribution which yields you an estimate of mean along with confidence intervals which you don’t get with padding. It actually subsumes the padding method since before you have any data you can add pseudo events to the parameters alpha and beta representing some prior distribution, in this case the league average, and you can tinker around with how much weight you assign to those.
LikeLike
Great article and I think it will definitely help with the model I am creating.
Question: Is it correct in assuming those padding values would only be applicable to player statistics, and not a team’s overall stats? I assume the team’s padding value would be much lower because there’s less variance game to game (since a team’s statistics is an average/sample of 8-12 players).
If that’s correct, it would be awesome and much appreciated if you could share or do a post for padding values for team statistics!
Thanks!
LikeLike
Excellent read, thank you for posting this. One question, do you have any sort of correlation data for the end of season outcomes vs projections for the various metrics?
LikeLike